• Home • Curriculum vitae • Publications • Earthworms • Insects • Plants • Research projects •

 Beetles collected at "Evolution Canyon", lower Nahal Oren, Mount Carmel, Israel
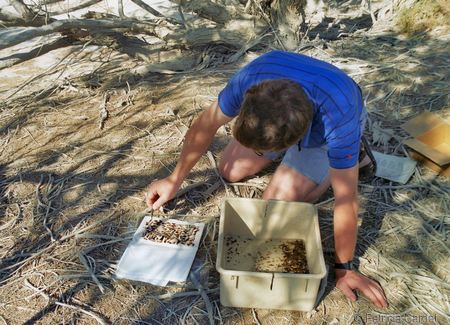
Six hundred twenty-nine beetle species (Appendix) have been recorded at “EC” so far (Chikatunov et al. 1999, 2004). Out of them, 611 (97%) were collected by the authors, whereas 18 had been recorded in literature or in the Tel Aviv University beetle collection. The beetles were collected by means of pitfall traps, individually under stones, by netting and by UV light, with the same effort on both the opposite south-facing slope and north-facing slope (SFS and NFS, respectively). With exception of the UV light method, they were collected with the same effort at three stations on each slope (upper part: SFS1 and NFS7, middle part: SFS2 and NFS6, lower part: SFS3 and NFS5) and at the valley bottom (VB). The UV light collection was done only at SFS2, SFS3, VB, NFS5 and NFS6. More species were significantly (Binomial test, expected interslope proportion 0.5, double-sided p-value = 0.036) recorded on the SFS than on the NFS (Table 1). Since the collection effort was similar on each slope, it is possible to reject the Ho hypothesis that the number of species on both slopes are equal. On both slopes, the number of species decreases from the lower part towards the top. |
||||||||||||||||||||||||||||||||||||||||||||||||||||||||||||||||
Table 1The numbers of recorded beetle species at “EC’ and stations. Please note that the species recorded in literature and in the beetle collection are not included.
|
||||||||||||||||||||||||||||||||||||||||||||||||||||||||||||||||
As expected, no panmictic population present at "EC", but with growing interstation distance the similarity between the compared stations significantly decreased,indicating isolation by distance at the microsite. The Spearman Rank Order Correlation between the interstation similarity (Table 2) and the surface interstation distance is highly significant (Spearman R = -0.74, t(N-2) = -4.82, p = 0.0001). A similar conclusion is also indicated by Fig. 1.
Table 2Similarity index between stations at “EC” computed according to Jaccard (green "triangle") and interstation distance in meters (yellow "triangle").
|
||||||||||||||||||||||||||||||||||||||||||||||||||||||||||||||||
Figure 1: Tree diagram showing the relationship between stations at "EC".
Distance method: percent disagreement. Linkage: unweighted pair-group average method. |
||||||||||||||||||||||||||||||||||||||||||||||||||||||||||||||||
 |

| • Home • Curriculum vitae • Publications • Earthworms • Insects • Plants • Research projects • |
•
Contact
•
Links
•
Webdesign
•
Copyright •

|